创建基于数组的 NumPy Trace step 模板
为分析选择信号 “CarSpeed” 后,接下来创建实际的 Trace Analysis(测量轨迹分析)。本教程通过基于数组的 NumPy Trace step 模板来实现,该模板以通用形式封装分析规则,便于复用。
要创建该 Trace step 模板,请在操作窗口的 Trace Step Templates 选项卡中单击新建 Trace step 模板图标,然后选择 。 (手册中的 General approach(通用方法) 章节说明了不同类型的 Trace step 模板及其创建方式。)
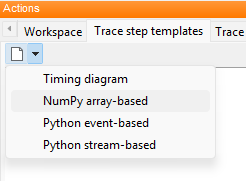
创建新的基于数组的 NumPy Trace step 模板
在弹出的对话框中填写以下内容:
在 Common 区域中,输入名称 CheckThreshold 作为该 Trace step 模板的 ID。
可选输入说明文本。
在 Signals 区域中,单击
 创建名为 Signal 的输入信号(方向 IN)。
在 Parameter 区域中,单击
创建以下两个参数:一个名为 threshold、类型为 FLOAT 的输入参数(方向 IN)
一个名为 maxValue、类型为 FLOAT 的输出参数(方向 OUT)
填写完成后的对话框应如下所示:
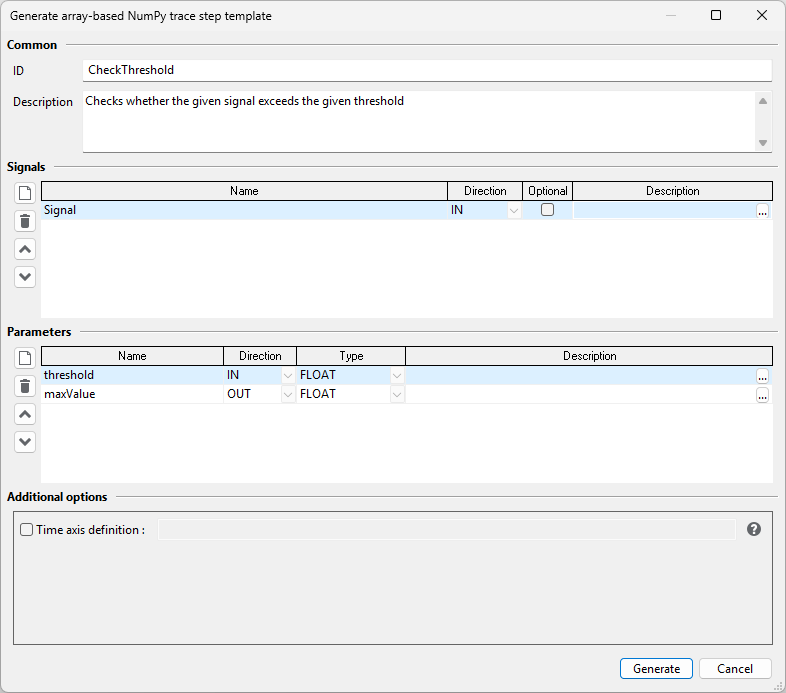
用于创建基于数组的 NumPy Trace step 模板的向导
与其他 Trace step 模板类型不同,此对话框按向导方式工作。也就是说,单击 Generate 按钮后,对话框中的内容会转换为一个 Python 类。该类按之前指定的 ID 命名,并描述该 Trace step 模板的全部内容。根据当前设置,此 Python 类会自动在 ecu.test 集成的 Python 编辑器或外部 Python 编辑器中打开。
Note
如果使用外部编辑器,可以通过添加 ecu.test 随附的接口来启用类型检查和自动补全。参见 Trace Analysis API。
生成类中的 GetDescription()、GetSignals() 和 GetParameters() 方法会反映刚才在对话框中完成的设置,并允许后续调整(生成后无法重新打开该向导对话框来修改 Python 类)。
@classmethod
def GetDescription(cls):
    """
    Returns the description of the trace step.

    :rtype: unicode
    """
    return 'Checks whether the given signal exceeds the given threshold'
@classmethod
def GetSignals(cls):
    """
    Returns the incoming and outgoing signals of the trace step.

    :rtype: list[SignalDefinition]
    """
    return [
        SignalDefinition('Signal', 'IN', optional=False, description=''),
        ]
@classmethod
def GetParameters(cls):
    """
    Returns the input and return parameters of the trace step.

    :rtype: list[ParameterDefinition]
    """
    return [
        ParameterDefinition('threshold', 'IN', description=''),
        ParameterDefinition('maxValue', 'OUT', description=''),
        ]
该 Trace step 模板的实际分析规则必须在 Process() 方法中指定(位于生成类的最后)。该方法参数的说明可参见生成的 DocString、Creating array-based NumPy trace step templates(创建基于数组的 NumPy Trace step 模板) 章节以及 Trace analysis API reference(Trace Analysis API 参考)。
针对当前任务,也就是查找阈值超限,Process() 方法应按如下方式实现:
def Process(self, parameters, report, timeAxis, ranges, signals):
    """
    ...

    """

    # Copy parameters to local variables
    threshold =  parameters['threshold']

    # Maximum value, we have found so far. Initially this is NaN (not a number).
    maxValue = float('NaN')

    # Process() is called only once and receives a list of trigger ranges (or one range that
    # spans the entire time domain, when not using a trigger block). Here we iterate over each
    # of the ranges.
    for triggerRange in ranges:
        # triggerRange.GetValues() returns the values of the specified signal as a NumPy array,
        # which is cropped to the range, i.e. triggerRange.GetValues('Signal')[0] returns the first
        # value within the range, triggerRange.GetValues('Signal')[-1] returns the last.
        values = triggerRange.GetValues('Signal')

        # Analogously, triggerRange.GetTimestamps() returns the timestamps, cropped to the current
        # range. No signal name needs to be specified, as all signals are mapped to a common time axis.
        timestamps = triggerRange.GetTimestamps()

        # Check, whether triggerRange contains any values
        if values.size > 0:
            # values.max() returns the maximum value within the current range. The global
            # maxValue is updated accordingly.
            maxInRange = values.max()
            maxValue = max(maxInRange, maxValue)

            # thresholdExceededMask is an new Boolean array that contains True wherever the
            # corresponding element in values exceeds the given threshold.
            thresholdExceededMask = values > threshold

            # Report FAILED, when threshold is exceeded at least once
            if thresholdExceededMask.any():
                triggerRange.SetResultFailed()
                triggerRange.SetResultText('Threshold exceeded. Maximum in range: {}.'.format(maxInRange))

            else:
                triggerRange.SetResultSuccess()

        else:
            triggerRange.SetResultText('No values in the given trigger range.')

        # The report shall contain contiguous sub-ranges, where the threshold is either
        # satisfied or exceeded. The method CalculateRanges() can be used to create such
        # sub-ranges from a Boolean mask.
        reportElements = {
            False: ('Check OK', report.RESULT_ID_SUCCESS),
            True: ('Check FAILED', report.RESULT_ID_FAILED),
        }

        for subRange in self.CalculateRanges(thresholdExceededMask):
            triggerRange.Range(
                timestamps[subRange[0]], timestamps[subRange[1]-1],
                reportElements[subRange[2]][0], reportElements[subRange[2]][1])

    # Write back the determined maximum value
    parameters['maxValue'] = maxValue
保存编辑后的 Python 类后,新创建的基于数组的 NumPy Trace step 模板会出现在操作窗口的 Trace step templates 选项卡中。由于该模板带有输出参数,因此需要一个用于存储输出结果的 Package 变量。要创建该变量,请在 Variables 选项卡中右键单击,选择 ,并将其命名为 MaximumSpeed。
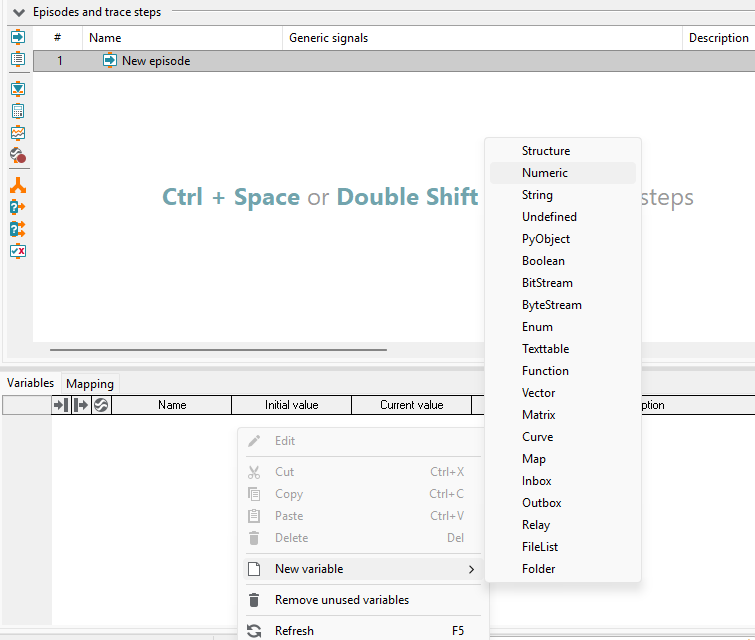
创建新的 Package 变量
信息
同一 episode 内不能同时写入和读取 Package 变量
在某个 episode 中写入的 Package 变量,不能在同一个 episode 中读取。只能在下一个 episode 中读取。
随后,在操作窗口的 Trace step templates 选项卡中,通过拖放将新创建的 CheckThreshold 模板插入到 Trace Analysis(测量轨迹分析)中。
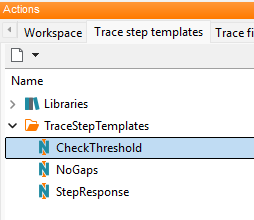
操作窗口中“trace step templates”选项卡内的 Trace step 模板“CheckTreshold”
插入 CheckThreshold 后,会自动打开对应的参数化对话框,需要填写以下内容:
将通用信号 Signal0 绑定到模板的输入信号 Signal。
将输入参数 threshold 设置为 75。
将新创建的变量 MaximumSpeed 绑定到输出参数 maxValue。操作时,在编辑参数表对应的 value 单元格时按键盘向下箭头键,然后从建议列表中选择该变量。
填写完成后的对话框应如下所示:
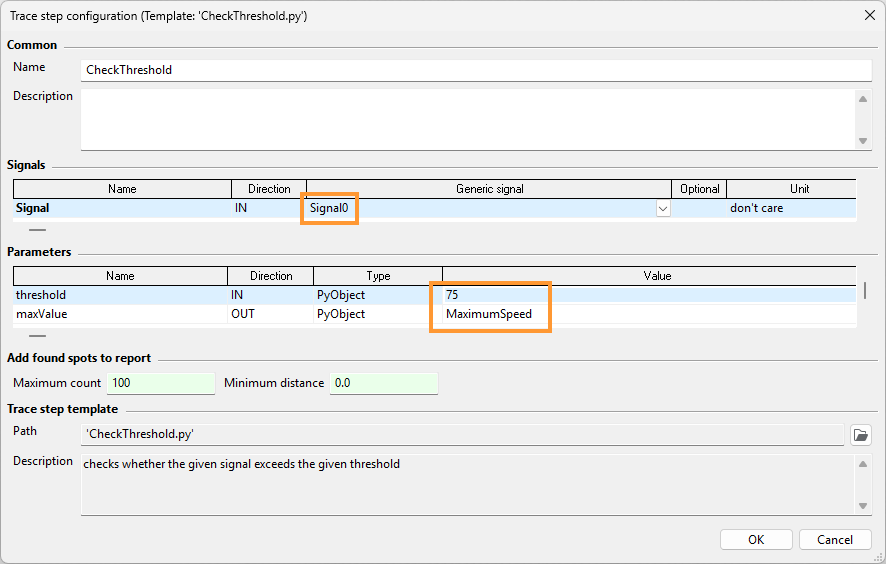
Trace step 模板的参数化设置
现在添加一个图表,用于显示信号以及 CheckThreshold Trace step 的结果。操作时,在 Trace Analysis 编辑器左侧 Episodes and trace steps 下单击按钮  (New Plot),然后单击 OK 接受默认图表设置。
此时分析应如下所示:
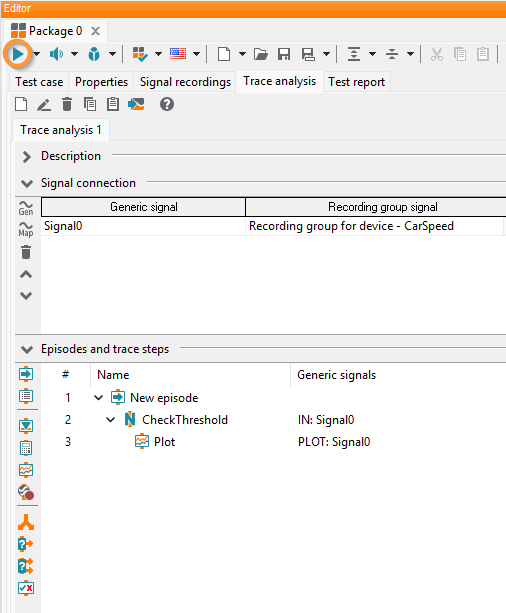
完成后的 Trace Analysis
执行 Trace Analysis(即单击上一张图片中标出的按钮)后,Test report 选项卡中会显示以下结果:
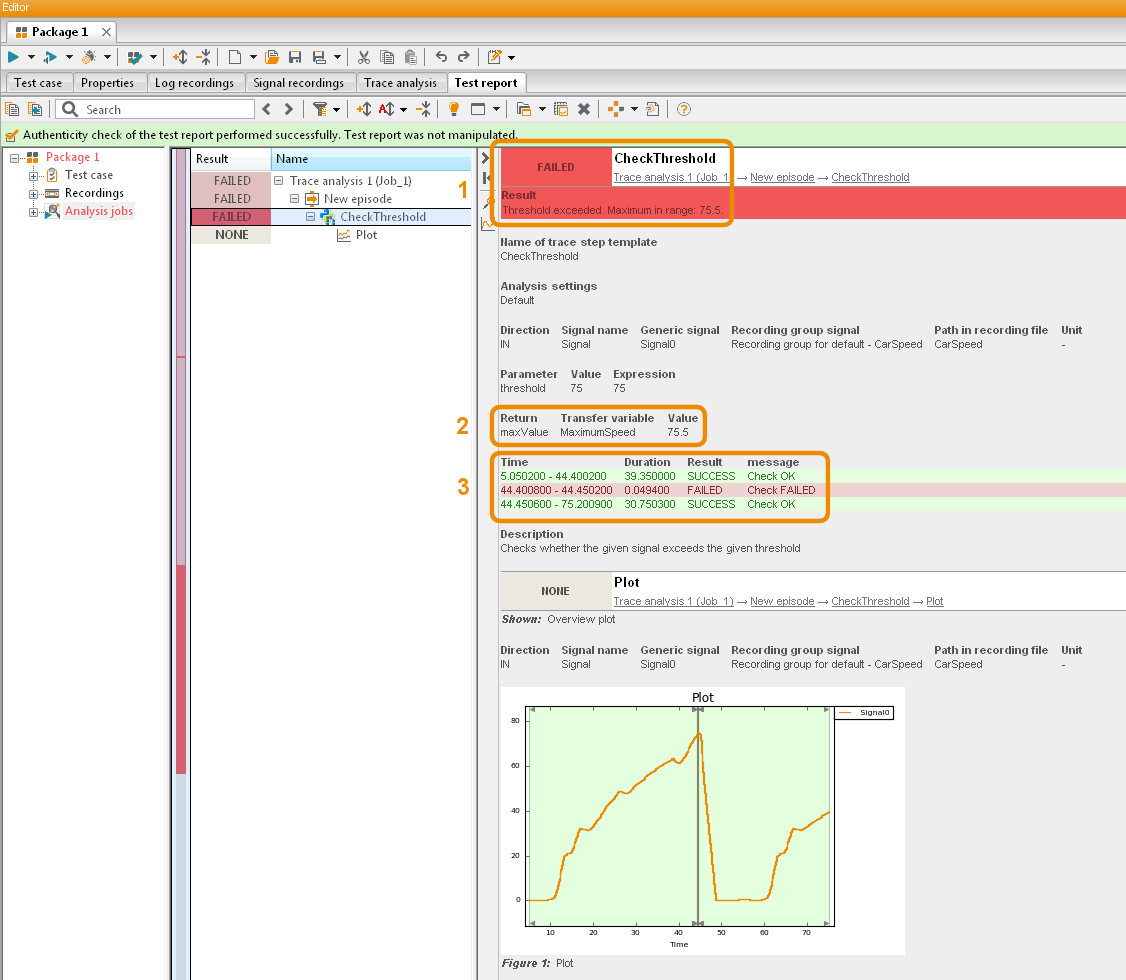
Trace Analysis 的结果
报告包含以下关键分析结果:
75 km/h 的阈值被超出,因此该 Trace Analysis 给出结果 FAILED。
阈值超限发生在测量时间 44.400800 到 44.450200 之间。
最大车速为 75.5 km/h。
信息
延伸参考
在 ecu.test 中,创建用户自定义 Trace step 模板是 Trace Analysis 的一个关键能力。关于如何逐步创建 Trace step 模板,可参见 Creating trace step templates(创建 Trace step 模板) 章节。关于基于数组的 NumPy Trace step 模板的特定细节,可参见 Creating array-based NumPy trace step templates(创建基于数组的 NumPy Trace step 模板) 章节。后者还包含基于本教程的更多示例。